Sales Reports
Track your sales performance across different time periods and categories.
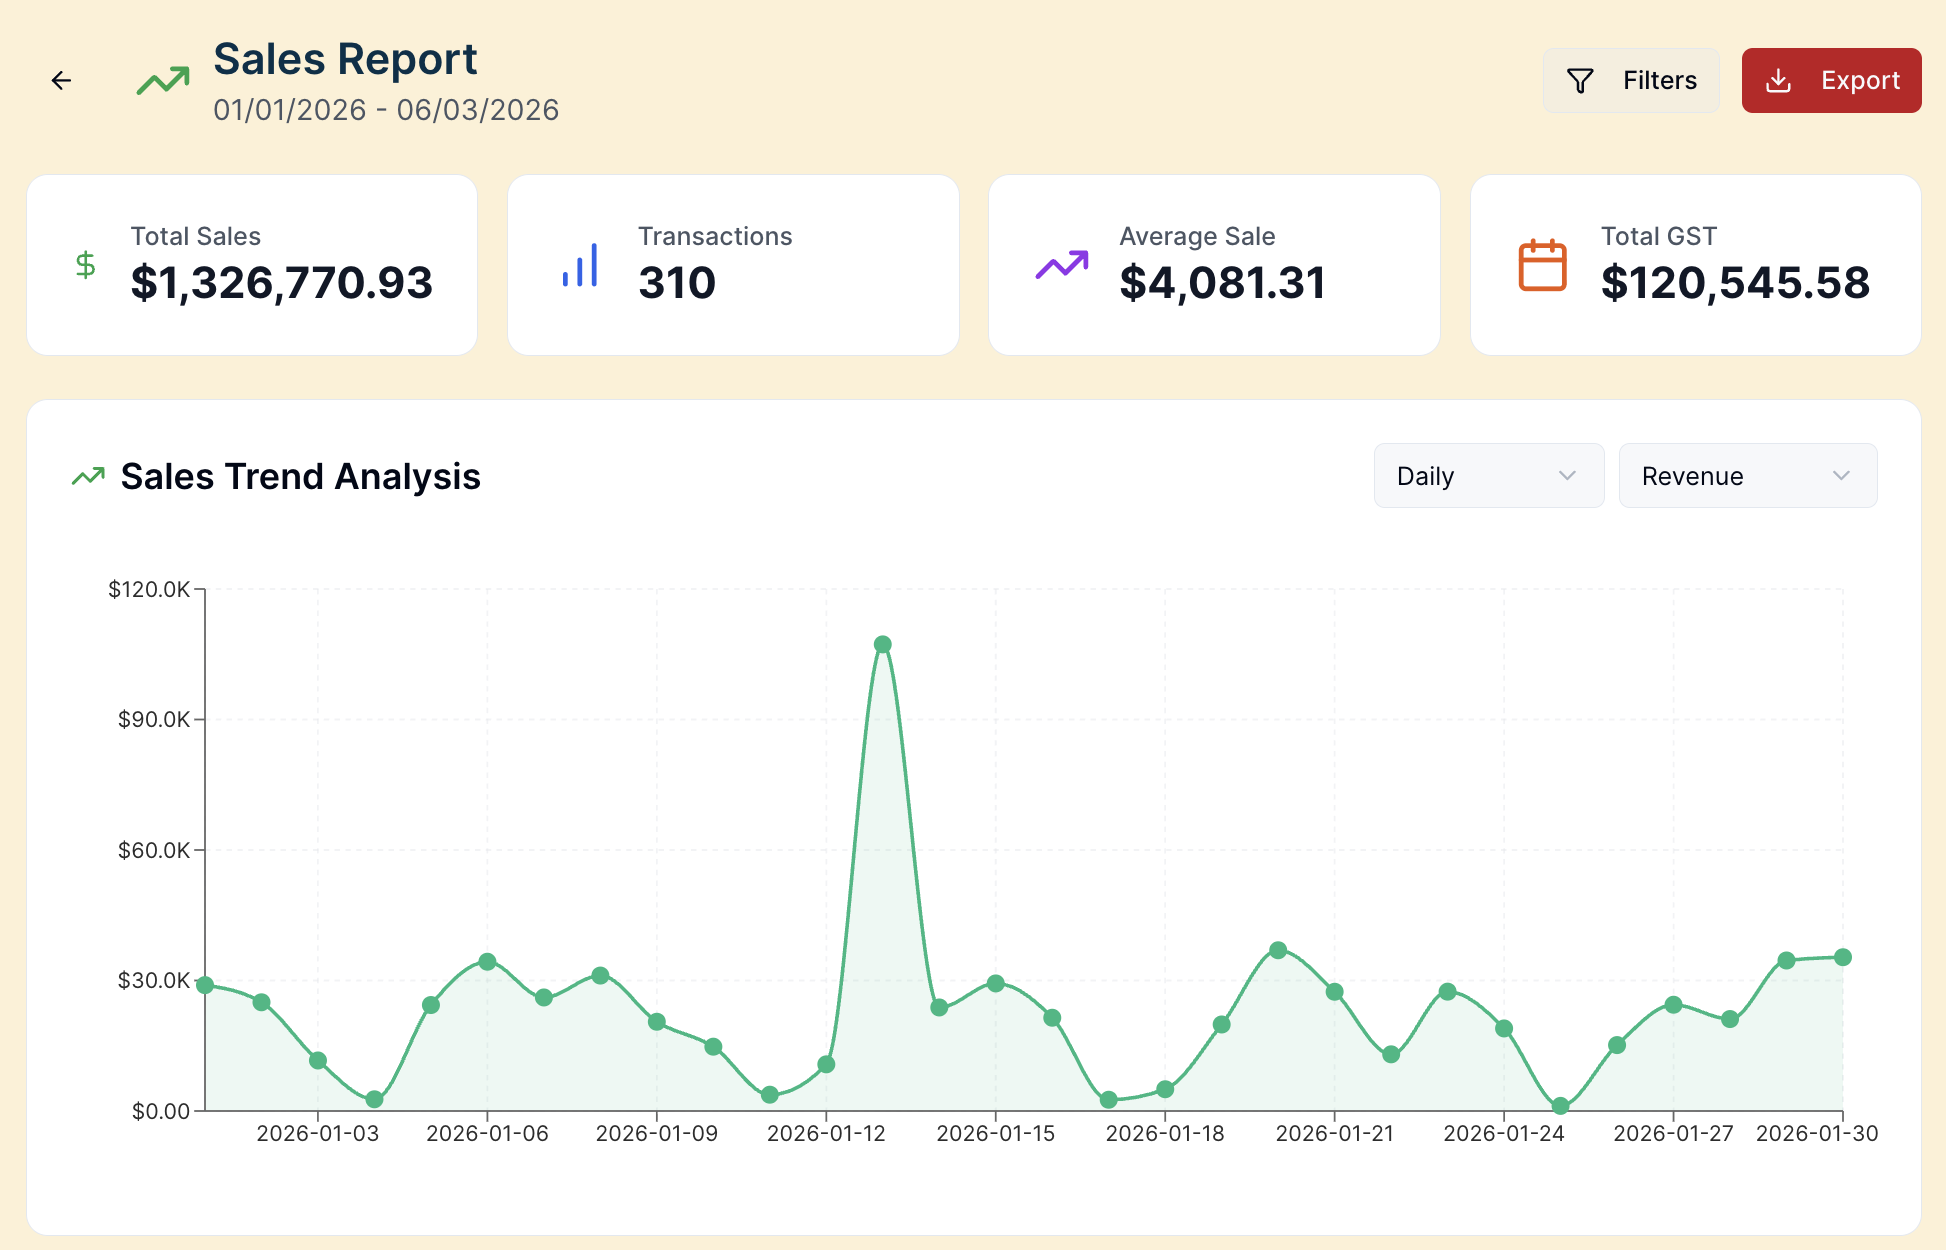
Standard Sales Report
Total Sales
Transactions
Average Sale
Total GST
Top Products by Revenue
Sales by Type
Customer Value Segments
Sales vs Transactions Trend
Top Performing Customers
Viewing Custom Reports
Viewing Daily Sales
Select the 'custom reports' category
Go > Daily Sales
Select run
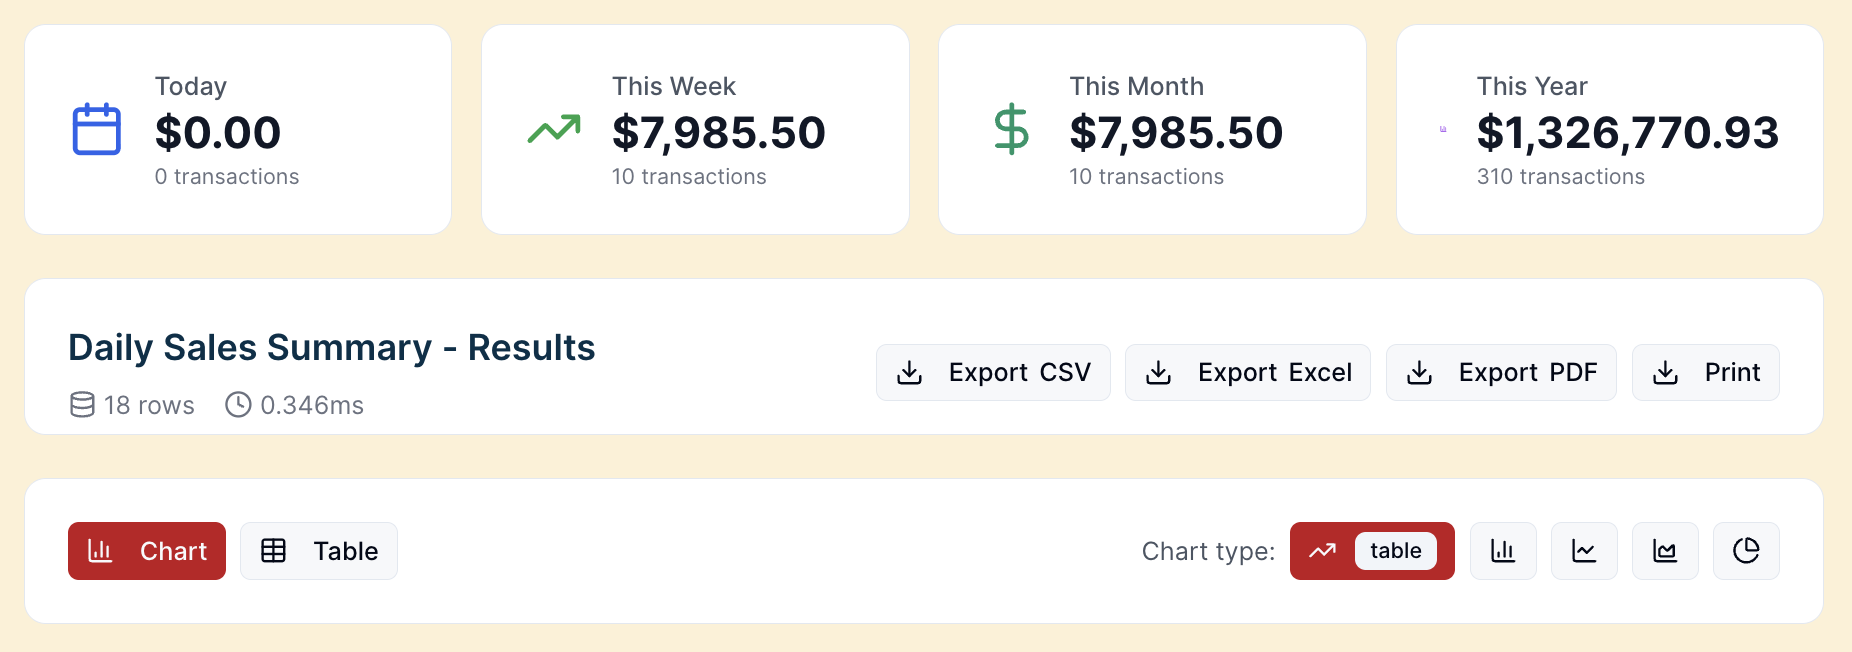
View breakdown by avg amount, total sales, transaction count,
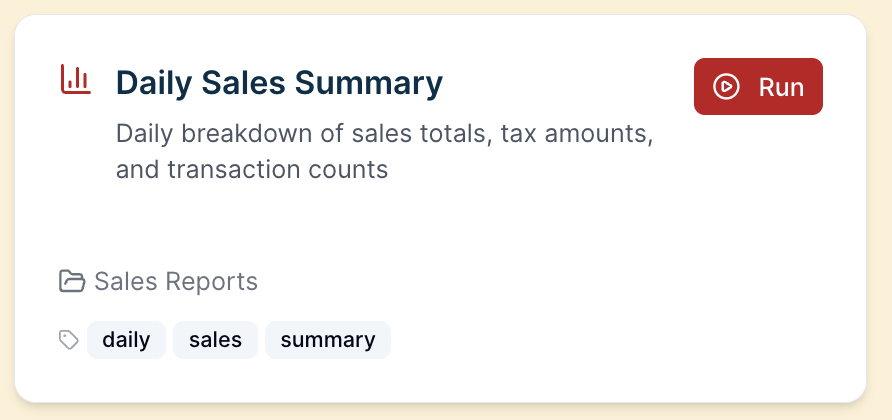
Daily Sales Summary
See today's performance at a glance:
Total Sales - Revenue for the day
Transactions - Number of sales
Average Sale - Average transaction value
Items Sold - Total units sold
Sales by Period
Compare sales across different timeframes.
Weekly Report
Sales for each day of the week
Week-over-week comparison
Best and worst days
Monthly Report
Daily breakdown for the month
Month-over-month comparison
Trending products
Custom Date Range
Click Custom Range
Select start and end dates
View aggregated data
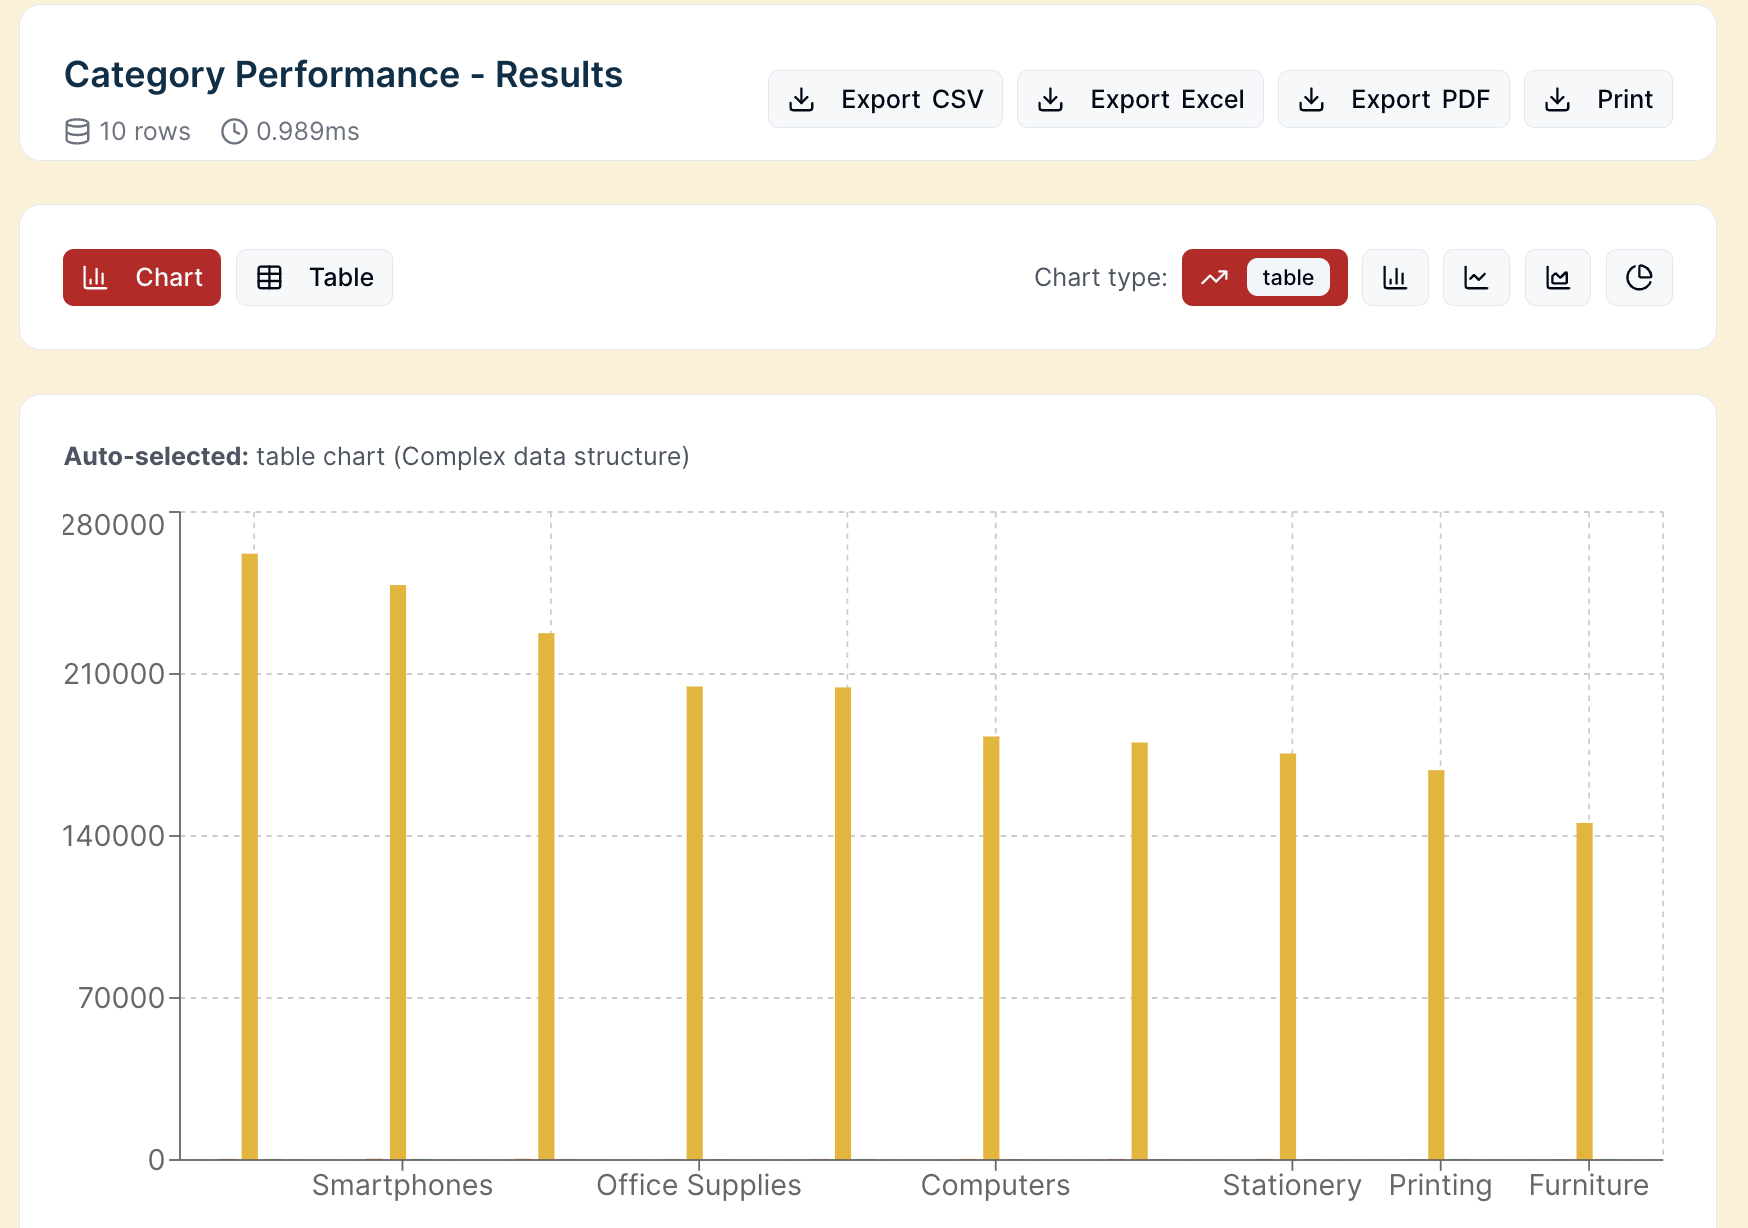
Sales by Category
Understand which product categories perform best:
Go to Reports > Category Performance
See:
Revenue per category
Percentage of total
Units sold
Profit margin
Sales by Staff
Track individual performance:
Sales Total - Revenue per staff
Transactions - Number of sales
Average - Average sale value
Items - Products sold
Payment Methods
See how customers pay:
Cash vs Card breakdown
Account sales
Split payments
Tips
Use hourly reports to schedule staff for busy periods.
Weekly comparisons show whether you're growing.
Low-performing categories may need promotions or review.